Xdebug
Xdebug can be used to debug both web requests as well as cli scripts (e.g., Drush commands).
Stack Setup
Xdebug integration is disabled by default as it causes a roughly 20% performance hit. To enable it:
fin config set --env=local XDEBUG_ENABLED=1
fin project start
To verify that Xdebug was enabled:
$ fin exec php -v | grep -i xdebug
    with Xdebug v2.7.2, Copyright (c) 2002-2019, by Derick Rethans
Next, follow the IDE specific setup steps:
Debugging with PHPStorm
First, follow the setup instructions to enable the Xdebug integration.
Automatic Setup
PHPStorm makes debugging setup very easy using the Incoming Connection Dialog.
- Open a project in PHPStorm and set a breakpoint wherever you like
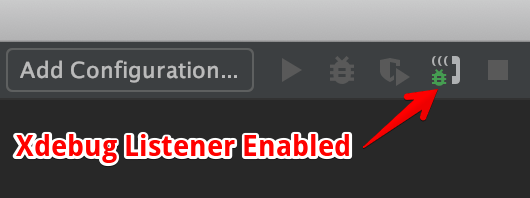
Click on the Start Listening for PHP Debug Connections button in PHPStorm
Open the project in a browser
A debugging session will start and Xdebug will initialize a connection to PHPStorm.
Click on Accept in the Incoming Connection From Xdebug dialogue in PHPStorm
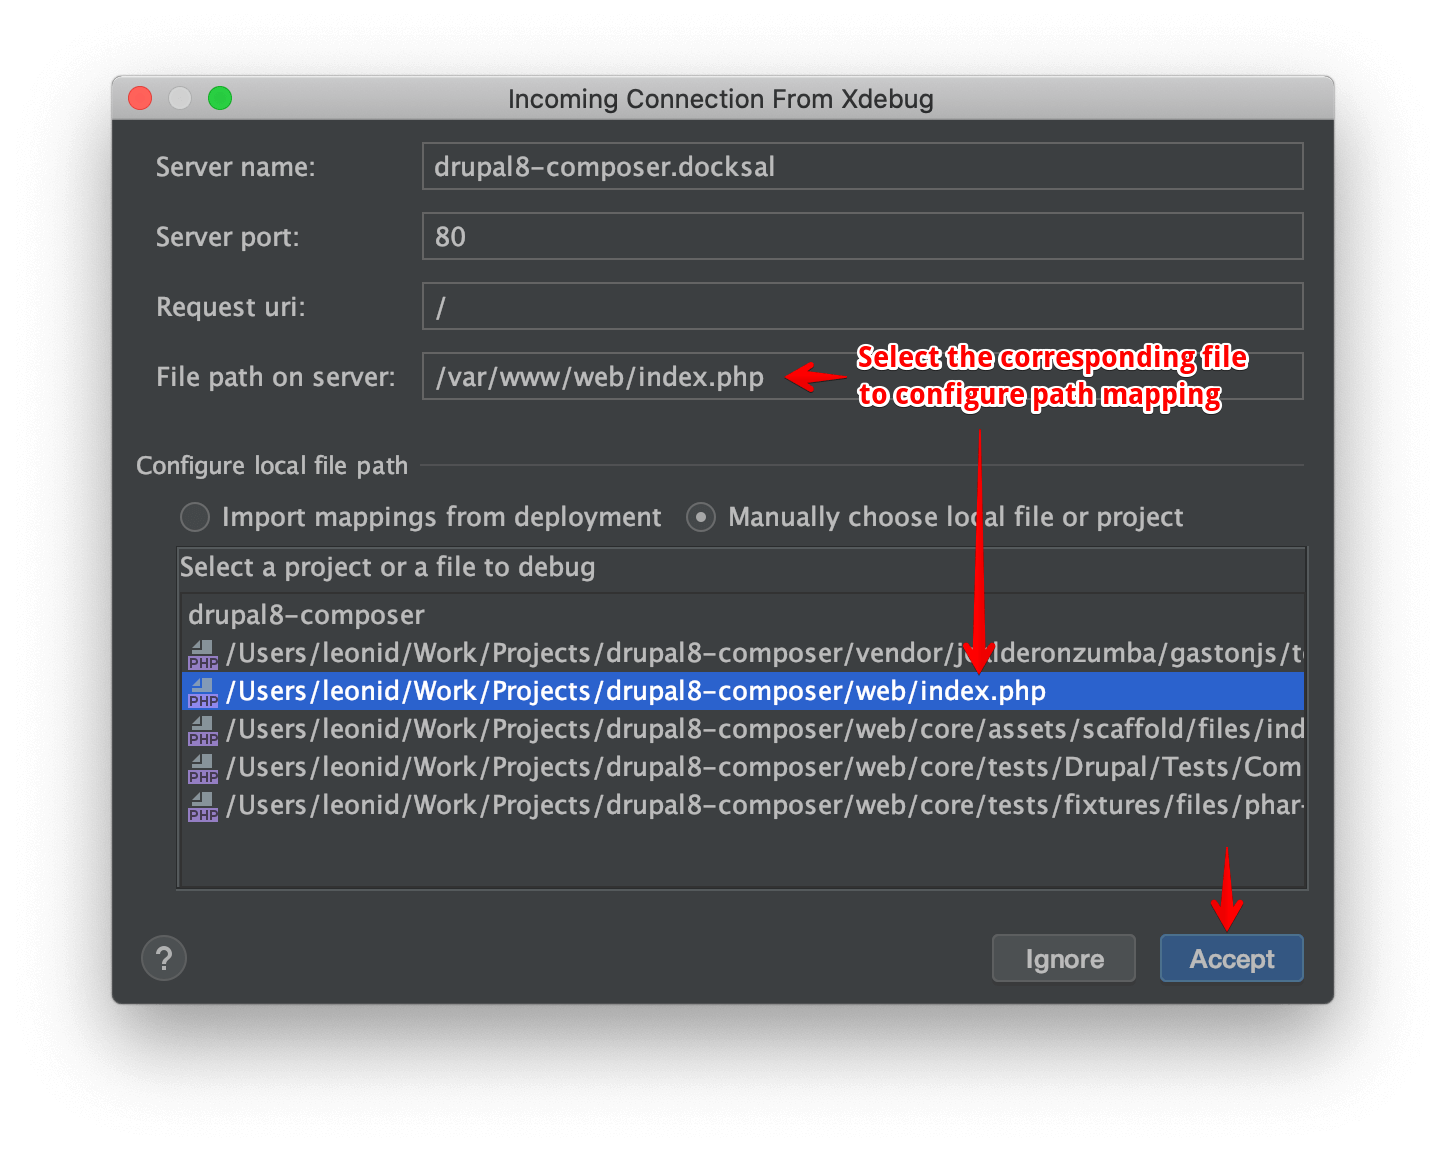
PHPStorm automatically configures a server and directory mappings between the host and the server.
Directory mappings are very important, as that’s how PHPStorm knows how to map sources on the server to those on
the host. By default, you will not be able to debug anything above the project’s docroot folder.
If you don’t get the Incoming Connection From Xdebug dialogue or you need to debug scripts above the docroot
directory, see the manual setup steps.
Manual Setup
- Under Preferences > Languages & Frameworks > PHP > Servers add a new server
- Set Name and Hostname to project’s virtual host (e.g.,
myproject.docksal) Configure host to server directory mappings
Map the project directory on the host to
/var/www/on the server: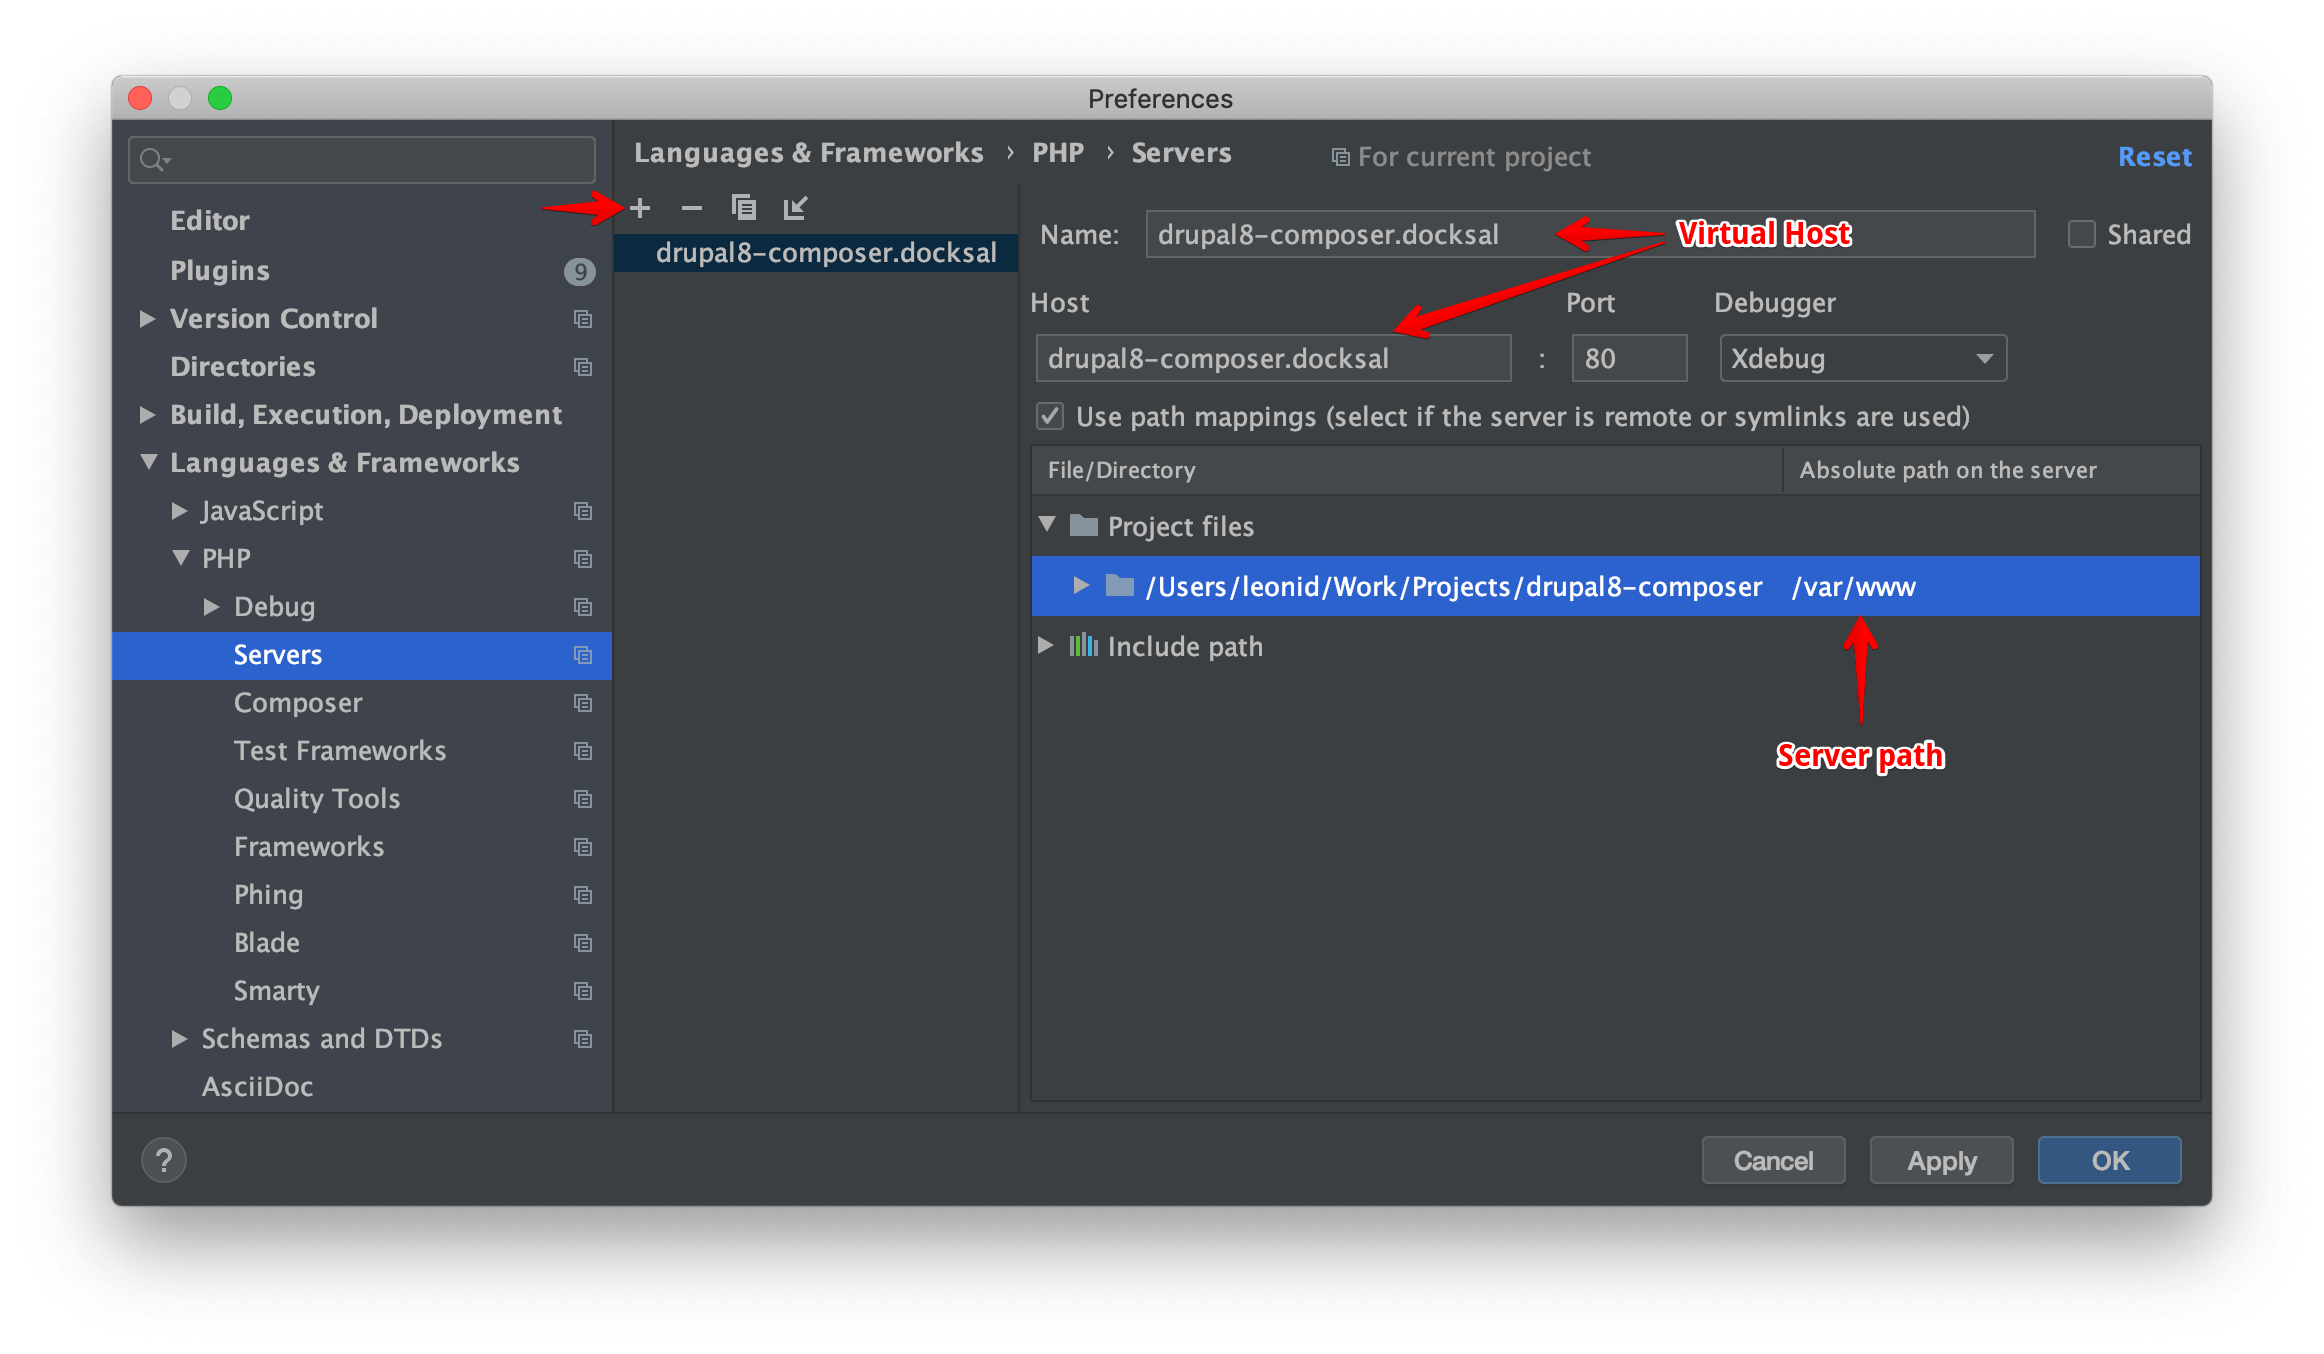
With this manual setup you will be able to debug scripts within your project’s root (/var/www/ on the server).
CLI Scripts
First, follow automatic or manual instructions to configure server and path mapping settings in PHPStorm.
To debug PHP CLI scripts, we have to tell PHPStorm which existing server configuration to use via the
PHP_IDE_CONFIG variable. This can be done using the following commands:
fin config set --env=local 'PHP_IDE_CONFIG=serverName=${VIRTUAL_HOST}'
fin project start
The script you are trying to debug must reside within the project root directory (/var/www/on the server) or
PHPStorm won’t be able to access the scripts’s source code and debug it.
CLI Scripts: Drush
To debug custom Drush commands, make the following additional adjustments in PHPStorm settings:
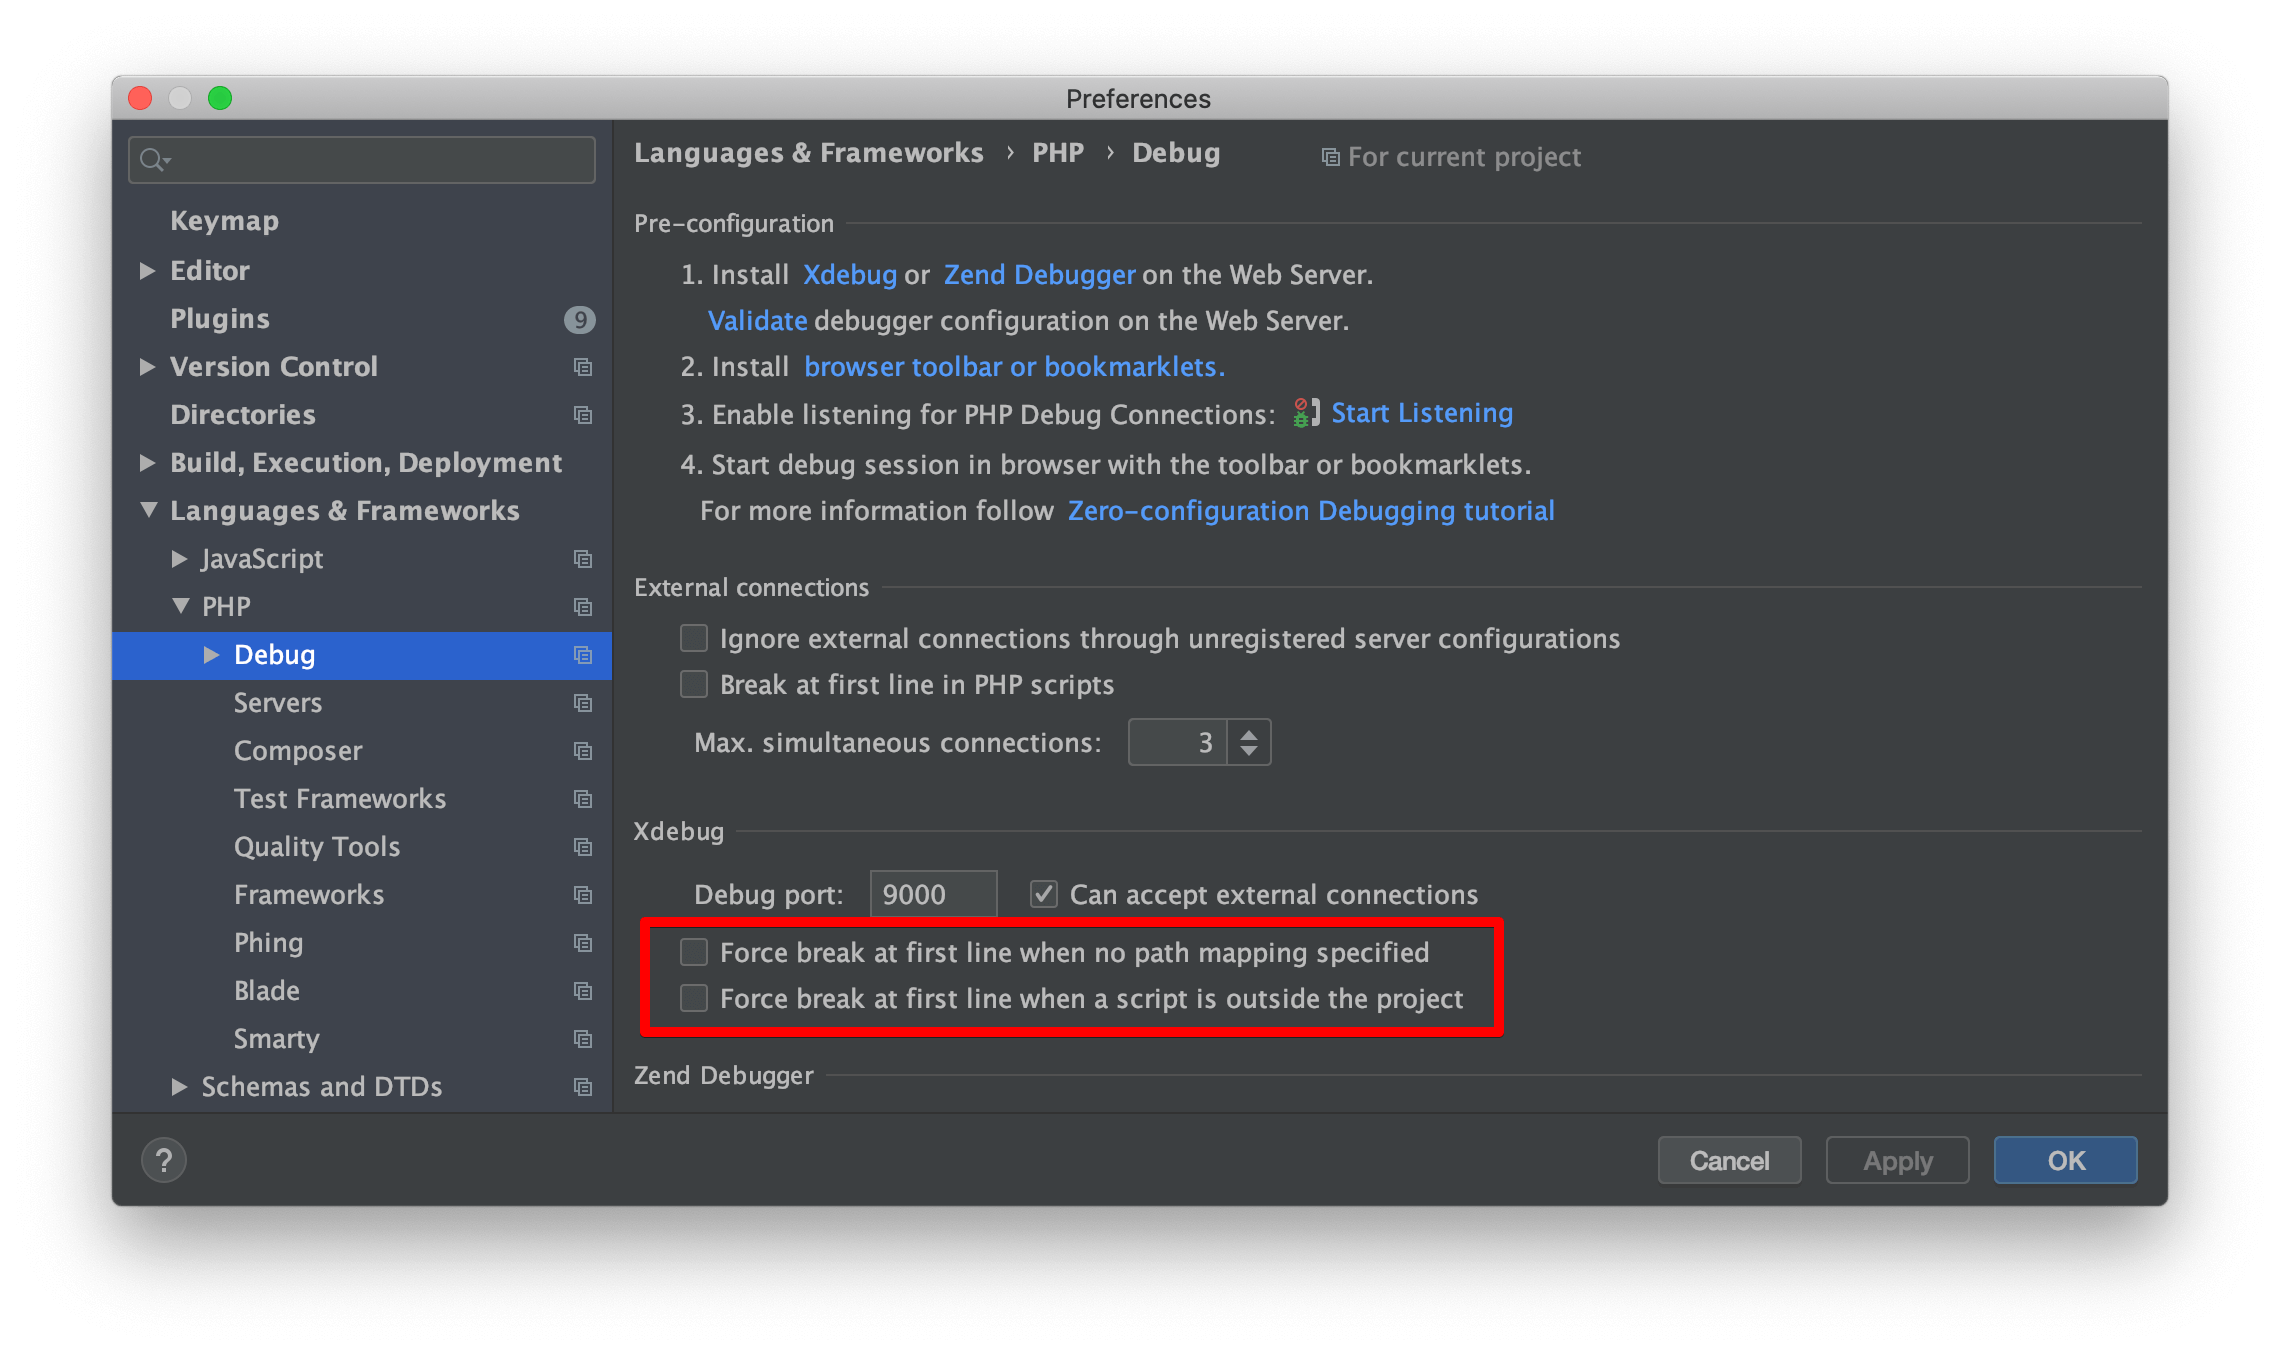
- Go to Preferences > Languages & Frameworks > PHP > Debug
- Uncheck Force break at the first line when no path mapping specified
Uncheck Force break at the first line when a script is outside the project
You can run your scripts in console and debug them in the same way as browser requests. For example, you can run
fin drush fl and debug this Drush command from the Features module.
Debugging with Visual Studio Code
- Follow the setup instructions to enable the Xdebug integration
- Install PHP_Debug plugin by Felix Becker
Configure PHP Debug Settings
- Click Debug Icon in left sidebar
- Click Configuration Gear in top bar, select
PHPfrom the dropdown list - Add path mappings should be configured properly
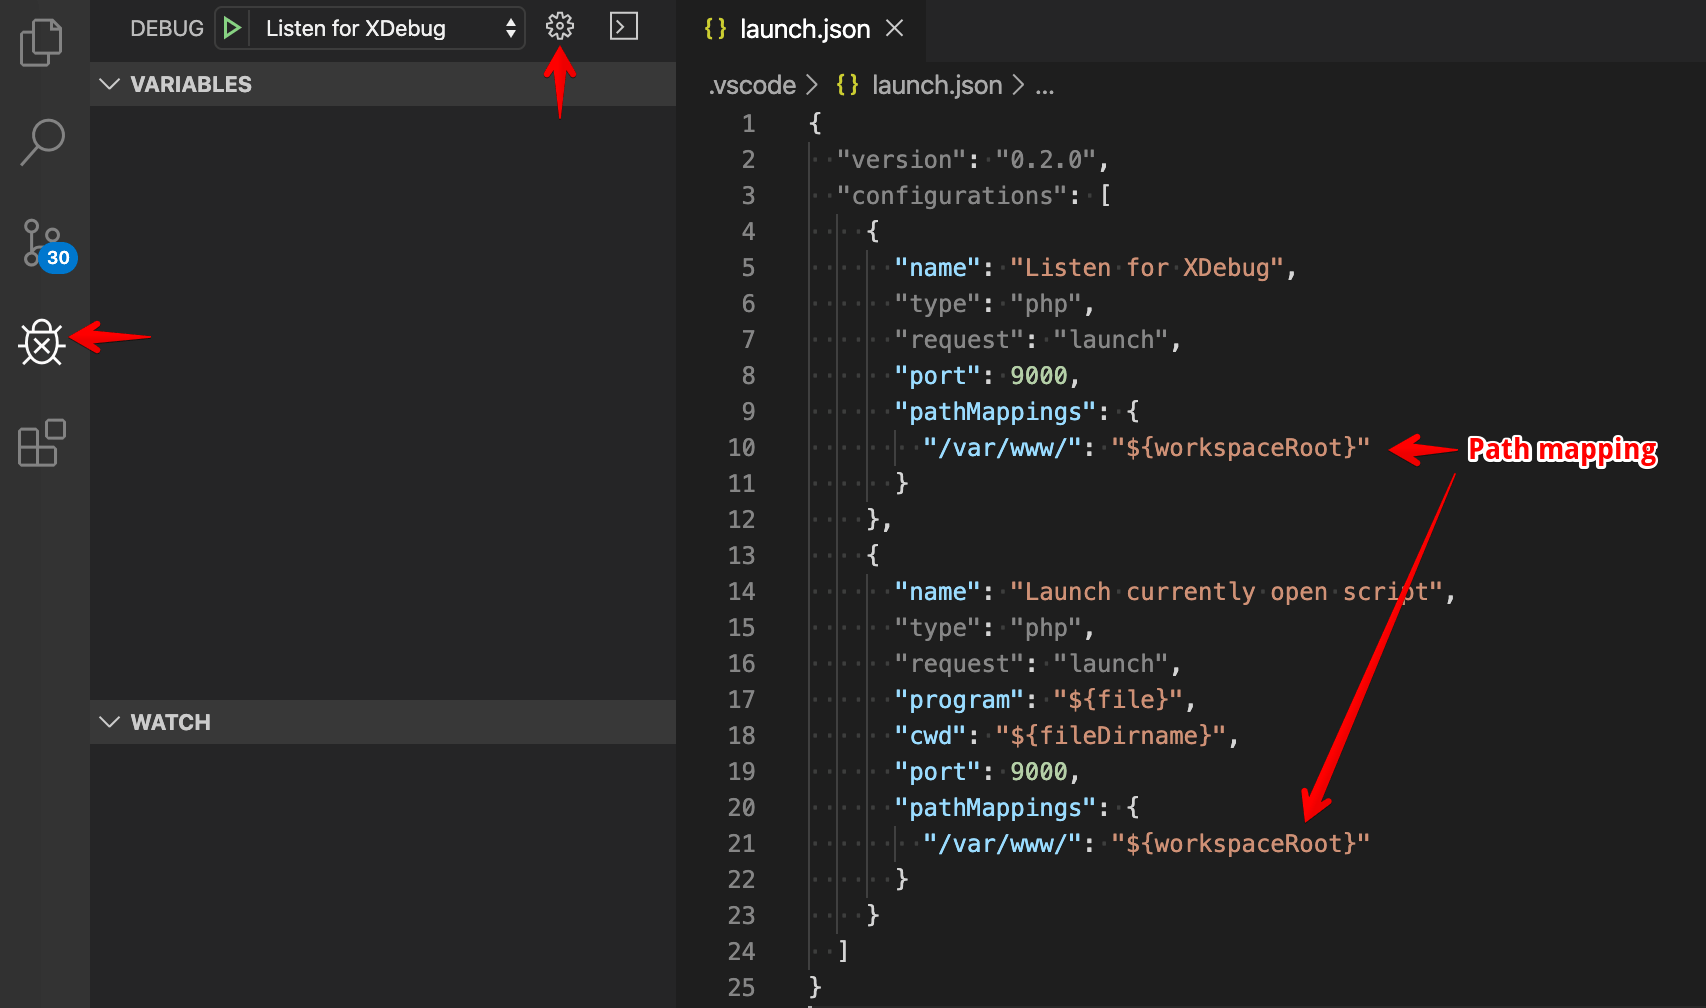
Here is an an example of what
launch.jsonshould look like:{ "version": "0.2.0", "configurations": [ { "name": "Listen for XDebug", "type": "php", "request": "launch", "port": 9000, "pathMappings": { "/var/www/": "${workspaceRoot}" } }, { "name": "Launch currently open script", "type": "php", "request": "launch", "program": "${file}", "cwd": "${fileDirname}", "port": 9000, "pathMappings": { "/var/www/": "${workspaceRoot}" } } ] }Set a breakpoint
Select the Listen for XDebug configuration from the dropdown and click Start Debugging
You can debug both web requests and cli scripts using this configuration.
Debugging with NetBeans
- Follow the setup instructions to enable the Xdebug integration
- Open NetBeans Debugging configuration (“Tools> Options > PHP > Debugging”) and set “DebuggerPort” to 9000
- Open your project in NetBeans
Configure project properties:
- Right mouse click on project name, then “Properties” from the dropdown menu
- Under “Sources”, set correct Web Root folder by clicking “Browse” button (usually it’s
docroot) - Under “Run Configuration”, use project’s virtual host (e.g.,
myproject.docksal) to set the Project URL - Click “OK” to save project properties
Set a breakpoint wherever you like
In NetBeans, with the whole project selected or one of the project files opened and active, press
<CTRL> + <F5>on your keyboard to start the debugger
Debugging with Atom
- Follow the setup instructions to enable the Xdebug integration
- Install PHP-Debug Plugin
Configure PHP Debug Settings (Preferences > Packages)
- Search for “php-debug”
- Click “Settings” button below plugin
- “Server” can be set to
* - “Server Listen Port” should be set to 9000
- Make sure “Continue to listen for debug sessions even if the debugger windows are all closed” is checked. This will make the debugger window open automatically.